
The DCP Compliance Patterns That Predict Approval
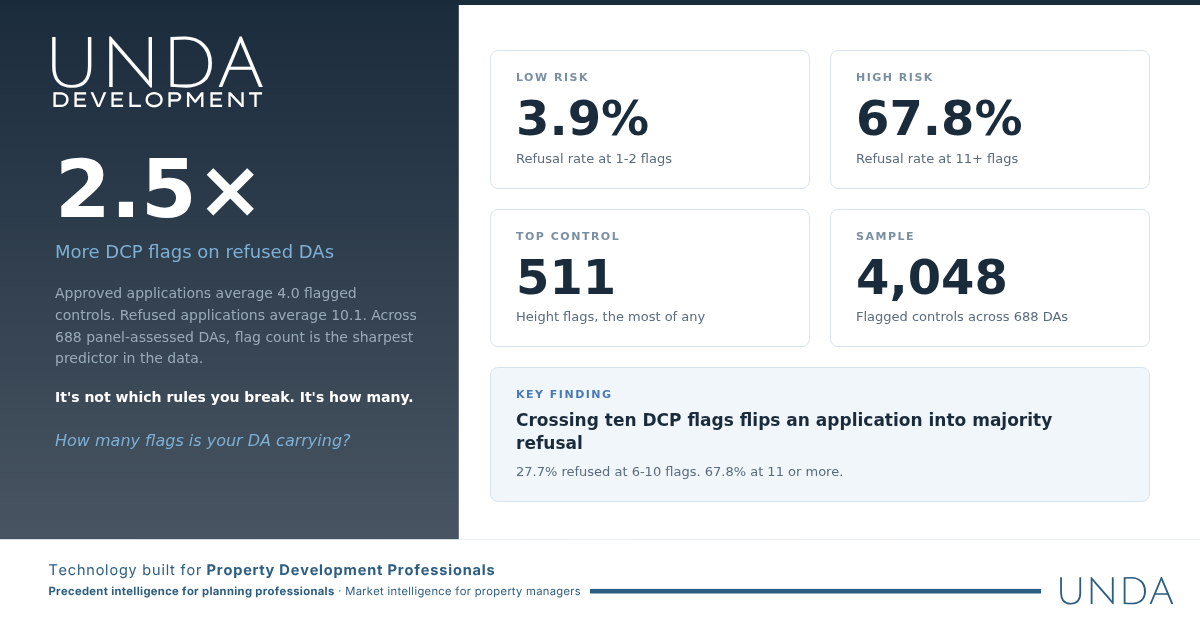
Refused DAs average 10.1 flagged DCP controls. Approved DAs average 4.0. The number you breach may matter more than which ones.
UNDA Development analysed every DCP compliance record attached to Waverley's panel-assessed development applications — 4,048 flagged controls across 688 DAs. What the data reveals isn't a simple pass/fail. It's a gradient. The more DCP controls an application is flagged against, the more likely it is to be refused, and the threshold is sharper than most applicants expect.
The 2.5× gap
Applications the panel approved carried an average of 4.0 flagged DCP controls. Applications approved with modifications averaged 5.4. Applications the panel refused averaged 10.1 — two and a half times the approved average.
This isn't about individual controls being dealbreakers. It's about accumulation. An application with three or four DCP flags is operating within normal parameters. An application with ten or more is in the refusal zone.
The refusal rate climbs steeply
Break the 688 applications into bands by flag count and the pattern sharpens.
Applications carrying 1–2 flagged controls were refused 3.9% of the time — 7 refusals out of 180. At 3–5 flags, the refusal rate climbs to 10.1%. At 6–10 flags it jumps to 27.7%, more than one in four. And at 11 or more flags, the refusal rate hits 67.8%: 61 of 90 applications refused.
The jump from the 6–10 band to the 11+ band is the sharpest in the dataset. Crossing the ten-flag threshold more than doubles the likelihood of refusal, and takes an application from a minority-risk position to a majority-refusal one. For applicants, this is the number that should inform pre-lodgement decisions.
Which controls get flagged most
Group the 4,048 flagged records by what they actually regulate and the ranking is dominated by the building envelope and its effect on neighbours.
Height is the most flagged control category by a clear margin — 511 flags across 385 separate applications. Privacy follows at 429 flags across 342 applications, then landscaping at 381, parking at 268, and side setbacks at 205. Streetscape and visual impact, solar access and overshadowing, and excavation each sit in the 150–175 range.
Design excellence, by contrast, appears on 116 applications. It's a recognisable name in Waverley's controls and it carries weight when it's raised, but it is not where most applications come unstuck. The volume sits with the measurable envelope controls — how tall, how close, how much of the neighbour's light and outlook the proposal takes.
That distinction matters for how you spend pre-lodgement effort. Height, privacy and setback breaches are quantifiable before you lodge. They can be modelled, tested against the control, and designed out. The controls generating the most assessment friction at Waverley are, for the most part, the ones an applicant has the most direct ability to fix.
One caveat: roughly a third of the flagged records use control names too varied to roll into a named category. The ranking above reflects the controls we can group reliably, not the complete distribution.
What this does — and doesn't — tell you
This data shows a strong correlation between DCP flag count and refusal. It's worth being precise about what that means.
It does not mean an application with four DCP flags will be approved, or that one with eleven will automatically be refused. Individual circumstances, the nature of the departures, and the quality of the justification all matter. It's also likely that flag count is partly a proxy for ambition — applications that push harder on the envelope trigger more controls and attract more scrutiny for reasons the flag count alone doesn't capture.
What it does mean is that the cumulative weight of non-compliance tracks with outcomes. Each flagged control is a point of assessment friction — something the assessment officer must evaluate, condition, or recommend against. Applications that create more friction tend to fare worse.
The practical implication: reducing the number of DCP controls your application triggers is likely more valuable than perfecting the justification for any single departure.
What this means for consultants
If you're preparing a DA for Waverley's panel, the compliance data offers a rough predictive framework. Keep your flagged controls under six and you're in the band where roughly nine in ten applications survive. Let them climb past ten and you're in the band where two-thirds don't.
It's a live question at Waverley right now — the council has been consulting on updates to its planning controls, including solar access and heritage guidelines, which sit directly in the flagged-control mix.
UNDA Development tracks DCP compliance patterns, flag counts, and outcomes across every DA in its database. If you want to see how your application's compliance profile compares to approved precedents, contact us.
About UNDA Development
UNDA Development provides precedent intelligence for property developers and property planning consultants — every DA, every panel decision, every compliance record at your fingertips. Our sister product, UNDA Management, provides market intelligence for strata managers. Learn more at unda.management