

Three Fields Left the Public Strata Register in May. Now You Can Only See the Buildings You Already Manage.
On 26 May 2026, three fields quietly left the NSW public strata register.
The managing agent's name. The agent's licence number. The date of the scheme's last AGM.
Everything else stayed. Plan number, address, lot count — all still there. What went was the record of who is responsible for a building, and when they last accounted for it.
Those fields now sit behind a Strata Hub login. You supply your name, phone and email. You nominate one building. Your details may be passed to that building's owners corporation and managing agent. Access can be revoked at any time, for any reason.
📊 Which produces something worth sitting with. It is not a small-firm problem.
At the register's last public state: 88,210 active schemes, resolving to 436 corporate groups. The largest of them, PICA, held 5,850 schemes — 6.63 per cent of the market.
That is not a large firm's advantage. It is the ceiling.
📉 Only 16 of those 436 groups hold more than 650 schemes. All 16 together account for 24.5 per cent of NSW. So a serious business with 650 schemes now sees about three quarters of one per cent of its own industry, and the largest operator in the state is blind to more than ninety-three per cent of it.
The loss is regressive — the median agent held 43 schemes, and proportionally it costs them far more. But it is not sectional. There is no firm in NSW large enough to be unaffected.
Nobody can see this market now.

Waverley's Panel Overrides Its Officer 2.9% of the Time. The Decision Is Made Before the Hearing.
We set out to publish a scorecard of what separates an approved DA from a refused one
Two of the three obvious predictors didn't survive the analysis. Here's what did 👇
📊 Across 726 Waverley panel decisions with a recorded officer recommendation, the panel diverged 21 times. An override rate of 2.9%
→ Officer recommended approval: panel approved 562 of 576 (97.6%)
→ Officer recommended refusal: panel refused 132 of 139 (95.0%)
→ Only 7 applications in the whole panel history were recommended for refusal and rescued at the hearing
The panel hearing isn't where the application is won. It's where a decision already reached gets confirmed
🔍 What we're NOT claiming, and why:
Refused DAs show 8.2 DCP compliance flags vs 3.4 for approvals. But an officer building a case for refusal documents every control the application fails. That's a record of the recommendation being written, not a predictor of it
Refused DAs show fewer consultant reports — until you notice 24.4% of them have ZERO recorded, vs 7.8% of approvals. That's an extraction gap in shorter refusal documents, not applicant behaviour
📉 Three things genuinely don't separate the outcomes:
→ Clause 4.6 variation count: 0.95 approved vs 0.80 refused
→ Project cost: median approved $619k, refused $812k, approved-with-modifications $1.35M. The most expensive category is the one that succeeds
→ Departure size: median 24.7% approved vs 24.7% refused
And one correction. We've previously published a 3.4% override rate for this panel. That came from a stored flag in the record which we've now found to be wrong — it misses 7 real overrides and marks 2 that never happened. Derived from the decisions themselves, the rate is 2.9%

One Group Holds 96.9% of Port Macquarie. Only Eight NSW Suburbs Have No Dominant Manager.
We mapped every NSW strata manager trading name back to the company that owns it, then recalculated market share suburb by suburb
The register and the market turn out to be different things
📍 Port Macquarie: one group — Neighbourly Strata — holds 682 of 704 managed schemes. That's 96.9%, across three trading names
Read brand by brand, it looks like nine operators competing. Map the brands to their owner and eight of the nine are one company
📊 Across all 1,162 active schemes in the suburb (not just the managed ones), that same group holds 58.7%. Both numbers are true — they answer different questions
🏘️ At the other extreme: of 164 NSW suburbs with 100+ managed schemes, only EIGHT have no group above 10% share
→ Rose Bay: 344 schemes, 83 groups, largest holds 7.9%
→ Burwood: 8.8%
→ Newtown: 109 schemes, 50 groups, 9.2%
All eight are inner Sydney or the eastern suburbs. Not one regional suburb makes the list
Meanwhile 20 of those 164 suburbs have a single group at 50% or more
The catch: run this without consolidating brands to owners and Port Macquarie never shows up as concentrated at all. Its largest single trading name is only 63.9%
Fragmentation gets overstated. Concentration gets understated. Every time
One caveat we state on everything: manager linkage is frozen at May 2026, when NSW Fair Trading withdrew agent details from public strata search

Half of Waverley's Refused DAs Fail the Same Control. Just 3% of Approved Ones Do
Half of Waverley's refused DAs fail the same DCP control. Just 3% of approved ones do
We normalised every compliance record in the panel's history. The most common reason for refusal and the most predictive one turn out to be different controls
⚠️ First, the trap
Landscaping and biodiversity is flagged on 41.5% of refusals — one of the most common findings in the record
It is also flagged on 30.3% of approvals. It tells you almost nothing
📊 Ranked by the gap between refusals and approvals, not by frequency
→ General objectives: 27.3% vs 0.5%
→ Design Excellence: 49.4% vs 3.0%
→ Streetscape and visual impact: 34.7% vs 4.2%
→ Heritage: 13.1% vs 2.1%
→ Then the drop: stormwater 2.2x, building lines 2.1x, excavation 1.6x, landscaping 1.4x
The top of that list is qualitative. The bottom is technical
A number can be conditioned, varied or traded. A design judgment cannot. That is why it survives to the determination
⚖️ And Clause 4.6 runs against intuition — 6.8% refusal rate when invoked, 36.5% when not. Correlation, not cause: it takes a consultant to write one, and refused DAs average 2.4 consultant reports against 4.1 for approved

34,067 NSW Schemes Report No Manager. Most of the Big Ones Aren't What They Look Like
34,067 active NSW strata schemes report no managing agent
Set the bar at twenty lots — where a conventional management fee starts to work — and that becomes 314
Then it gets strange. 35 of those have more than a hundred lots. The largest has 512
A 512-lot building running its own affairs with no licensed agent would be extraordinary. So we checked
📊 The tell is the AGM date
→ Managed schemes at 20+ lots with an AGM on record: 100.0%
→ Unmanaged schemes at 20+ lots with an AGM on record: 19.1%
A scheme that never reported an AGM has not completed a Strata Hub return properly. A blank manager field on an incomplete return is not evidence of a building without a manager
🔍 Split the 314 and three populations fall out
→ 100 registered in 2024 or later — new builds, developer-controlled, yet to hold a first AGM. The 512-lot tower was registered in August 2025. It has not been handed over
→ 154 registered earlier with no AGM ever reported — verify before you call
→ 60 registered earlier with an AGM on record — the defensible list
The honest number is not 314. It is 60 verified, 154 to check, and 100 that are simply too early
The register is self-reported, and at the top of the size range it shows
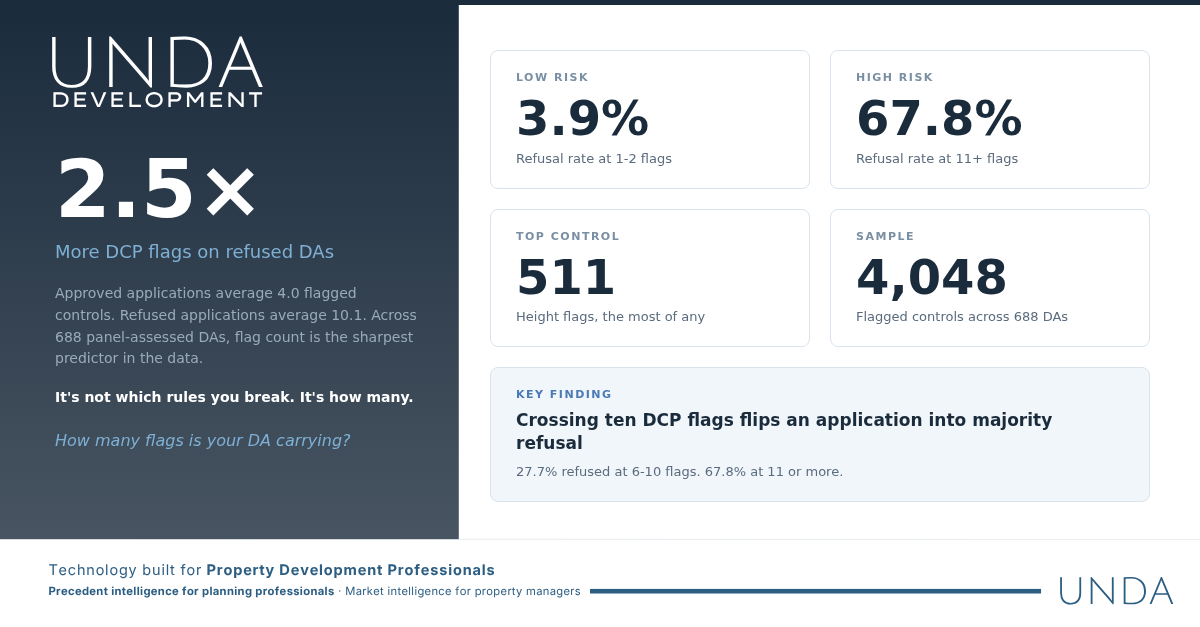
The DCP Compliance Patterns That Predict Approval
Our Week #2 article showed that Clause 4.6 variations succeed 91% of the time at Waverley
DCP compliance tells a very different story
📊 Approved DAs average 4.0 flagged DCP controls. Refused DAs average 10.1 — a 2.5× gap
The refusal rate climbs steeply:
→ 1-2 flags: 3.9% refused
→ 3-5 flags: 10.1%
→ 6-10 flags: 27.7%
→ 11+ flags: 67.8%
Crossing the ten-flag threshold takes an application from minority risk to majority refusal
🏗️ The most flagged controls aren't the subjective ones. Height leads with 511 flags across 385 applications, then privacy at 429, landscaping at 381. Design excellence appears on 116
The controls that sink applications are the ones you can measure before you lodge

Where NSW's New Strata Stock Is Actually Landing (It's Not Where You Think)
Ask anyone in strata where the growth is and they'll say Western Sydney
We mapped 7,486 new scheme registrations from 2020 to 2025. The data tells a different story
📊 The top 5 growth LGAs by new registrations:
→ Sutherland: 378 schemes
→ Newcastle: 323
→ Penrith: 320
→ Maitland: 303
→ Wollongong: 294
Seven of the top 10 sit outside Greater Sydney entirely
🏗️ The Western Sydney paradox: 16% of new schemes but 32% of new lots. Blacktown averages 38.4 lots per new scheme vs 3.0 in Maitland. Fewer buildings, much bigger ones
🏢 The managers winning new stock are regional operators, not Sydney's dominant players. Lake Group Property Services leads with 84 new schemes in growth corridors
The growth story is more nuanced than "Western Sydney"

Average DA Processing Time: What 561 Panel Decisions Tell Us
We analysed 561 panel-assessed DAs in Waverley to see how long the assessment process actually takes
📊 Overall median processing time: 167 days
The gap between outcomes is striking:
→ Approved: median 147 days
→ Approved with modifications: 182 days
→ Refused: 219 days — 49% longer than approved
🕐 Processing times have halved since 2017: median dropped from 258 days to 124 in 2025
💰 Cost of works is the strongest predictor: under $500K = 134 day median. $5M–$10M = 298 days
The fastest suburb (Dover Heights, 146 days) and slowest (Bondi Beach, 188) only differ by 42 days — much less than the outcome gap

The AGM Calendar: When 70,244 NSW Strata Schemes Sit Down to Talk
Every strata scheme in NSW holds an Annual General Meeting — the one time each year where owners formally evaluate management performance
We analysed 70,244 AGM dates across the entire market
📊 November is the busiest month: 6,834 buildings holding AGMs covering 104,450 lots
📉 January is the quietest at just 3,370 — the holiday period shuts down strata governance
🗓️ Q4 is the busiest quarter at 27.5% of all AGMs, Q1 the lightest at 21.8%
🌏 Regional variation matters too: 30.6% of Northern Beaches AGMs fall in Q4 alone, vs 21.1% in Q1
AGM dates don't tell you when contracts expire. But they tell you when the conversation about management is happening
The managers who grow consistently are the ones who know the rhythm

The Firms Behind Waverley's DAs — And Their Track Records
853 panel-assessed DAs in Waverley. 624 different applicants. And over half invoked Clause 4.6 variations.
We mapped every firm that's appeared before Waverley's local planning panel — who lodges, how often, and what their approval rate actually is.
📊 Overall panel approval rate: 76.2%
📊 Clause 4.6 invocation rate: 50.3%
📊 Panel agreed with staff recommendation: 96.6% of the time
The repeat players tell an interesting story
🔍 MHN Design Union: 18 panel DAs, ~72% approval
🔍 CSA Architects: 17 panel DAs, ~76% approval
🔍 Cape Cod Australia: 8 panel DAs, just 50% approval
Suburb matters too. Dover Heights has the highest approval rate at 81.4%. Bondi itself? Just 68.9%.
With the new "significant likely impacts" test narrowing what panels can refuse on, firms that already know how to navigate Clause 4.6 are positioned to benefit most.

Northern Beaches vs Eastern Suburbs: Where's the Real Growth?
One LGA. 3,731 strata schemes. And one firm controls nearly a third of them.
We mapped every active strata scheme across Sydney's Northern Beaches and Eastern Suburbs. The results challenge a few assumptions.
📊 Northern Beaches (1 LGA): 3,731 schemes, 44,006 lots
📊 Eastern Suburbs (3 LGAs combined): 6,292 schemes, 70,887 lots
Per council area, the Northern Beaches is the heavyweight.
But it's market concentration where the regions really diverge.
🔍 Northern Beaches: PICA Group holds ~30% of the market. The gap between first and second place is five-to-one.
🔍 Eastern Suburbs: The top firm holds just 8%. Boutique operators like Alldis & Cox, O'Neill, and R D Wedd dominate.
With new compliance requirements from the April 2026 strata reforms and Fair Trading's Taskforce issuing 80+ fines in its first year, the question isn't where new schemes are being built.
It's who ends up managing the ones that already exist.

3,000 New Homes for Bondi Junction. Here's What Waverley's DA Track Record Says About What Actually Gets Built.
Waverley Council just adopted a plan for 3,000 new homes in Bondi Junction. Towers up to 100 metres. Five precincts. It passed by a single vote — the Mayor's tie-breaker — after 830 public submissions, most opposed.
Every one of those dwellings needs a DA. We analysed all 1,750 Bondi Junction applications in our dataset. Here's what the assessment machine actually looks like.
📊 Nearly 4 in 5 panel-assessed DAs were approved — slightly higher than the rest of Waverley. The panel isn't the bottleneck.
🏗️ 73% of DAs assessed against FSR controls were non-compliant. Developers already push past the existing limits — new controls won't change that pattern.
⏱️ Median processing time: 145 days. One DA took 720 days. As proposals get larger, expect more outliers.
📉 DA volumes have been falling — 130 applications in 2005, just 39 in 2024. This is not a suburb already surging with activity.
🔍 The panel overrode its officers just once in 78 decisions. The officer's recommendation is effectively the determination.
The firms with the deepest track record — Cape Cod Australia (22 DAs), CSA Architects (17), Meriton/Karimbla (19), Scentre Group (10) — already know the assessment process. The Master Plan was drafted by Architectus. The question is who moves first under the new framework.
The Master Plan sets the ceiling. The DA process determines how much of it gets built.

More Than Half of NSW's Strata Managers Run Fewer Than 50 Schemes. Is That Sustainable?
NSW has 466 active strata managers. More than half of them run fewer than 50 schemes each.
We mapped every manager by portfolio size and ran the revenue math. Here's what the long tail looks like.
📊 243 of 466 managers (52%) have fewer than 50 schemes — but together they manage just 3.3% of the market
💰 The 152 managers with fewer than 10 schemes average $21K–$27K per year in portfolio revenue. That's total, not per scheme. Here's how we calculate it: https://www.unda.management/how-we-calculate-contract-values
📈 The viability inflection point appears around 50 schemes, where average portfolio revenue reaches $481K–$610K
🏢 Smaller managers don't manage smaller buildings — they average 22 lots per scheme vs 14.8 for mid-range operators
⚖️ NSW's latest strata reforms added new compliance obligations. The regulatory burden doesn't scale down — but the revenue does
When a manager with 15 schemes decides it's not worth the compliance overhead, those schemes transfer to someone bigger. That's how consolidation happens.

The Clause 4.6 Variation Success Rate: When Breaking the Rules Works
55% of Clause 4.6 variations at Waverley exceed the standard by 20% or more. These aren't minor adjustments — and 93% are approved.
We analysed every Clause 4.6 variation request — 439 DAs, more than 750 individual standard variations, 2017 to 2026.
📊 Floor Space Ratio and Building Height account for 94% of all variations. The panel has seen hundreds of each.
📋 One in five variations pushes past 50% departure. Applicants aren't tiptoeing around the edges.
📉 Minimum lot size variations succeed at just 66% — the panel is markedly more skeptical of subdivision departures than FSR or height.
🏗️ Usage is growing: 47 Clause 4.6 DAs per year in 2018–2021. By 2024, that hit 66 — up 40%.
The data says breaking the rules works at Waverley. But only if your justification holds.

The 10 Strata Managers Running NSW — And the 152 With Fewer Than 10 Buildings Each
10 strata management entities control 29% of every managed building in NSW.
At the other end, 152 managers average just 2.6 buildings each. That's fewer buildings per firm than most sole practitioners in any other industry.
We ranked all 466 NSW strata managers by scheme count and consolidated by corporate group. The power law is steeper than anyone publishes:
🏢 Top 10 entities: 15,712 buildings (29% of managed schemes). Just 2% of all managers.
📊 The middle 131 firms (100–999 schemes each): 37,586 buildings. 69% of the market. This is where the real competition lives.
📉 Bottom 243 firms (<50 schemes each): 2,951 buildings. Half the industry by headcount, running 5.4% of managed schemes.
The PEC's recent Strata Commissions Review identified 37 firms managing 5,000+ lots each. Useful — but UNDA's building-level data reveals the corporate group structures and competitive concentration behind those numbers.
We Mapped Every Strata Scheme in NSW. Here's What We Found.
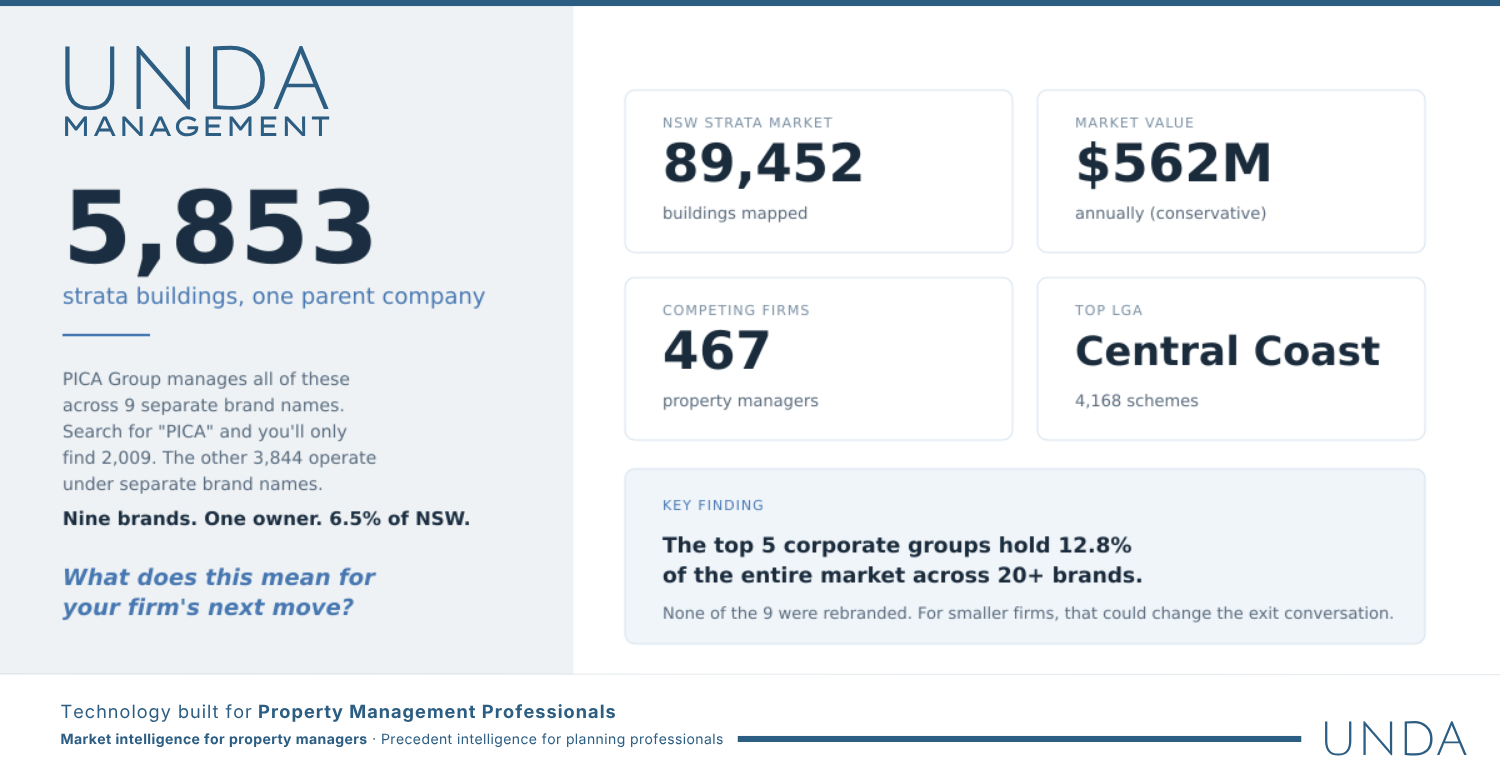
PICA Services manages 2,009 strata schemes in NSW. That's what the register says.
The real number is 5,853.
BCS Strata Management, Dynamic Property Services, ACE Body Corporate, NSW Strata Management — all PICA subsidiaries. Nine brands, one parent group, 6.5% of every strata building in the state.
We mapped all 89,452 NSW strata schemes and consolidated by corporate group. Here's what changes:
→ The market looks like 467 independent competitors. After corporate roll-up, the concentration is far steeper than anyone publishes.
→ Central Coast has more strata schemes than any Sydney LGA. City of Sydney ranks fourteenth.
→ The total market is worth $445M–$562M annually — a conservative estimate that excludes insurance commissions, major works fees, and legal costs.
The biggest question for mid-tier managers: who actually owns your competitors?

We Analysed 853 Waverley Panel Decisions. Here's What Gets Approved
The Waverley planning panel overrides the assessing officer just 3.4% of the time.
853 decisions. 29 divergences. Your panel hearing matters — but the officer's recommendation, formed before the panel meets, matters more.
We structured every panel decision Waverley's LPP has made since 2017. Here's what nobody tells you about how planning approvals actually work:
→ 76% of all panel applications get approved. The system isn't as hostile as the rejections make it feel.
→ Clause 4.6 variations have a 93% success rate — largely because applications that invoke them tend to be professionally prepared with formal justifications and objectives testing.
→ Refusal rates dropped from 39% in 2017 to under 9% in 2024. The panel is learning, and so are applicants.
→ Bigger projects don't get refused more. They get approved with modifications. The panel manages impact, not blocks it.
The practical takeaway: invest in the assessment phase, not the presentation. The data says that's where outcomes are decided.